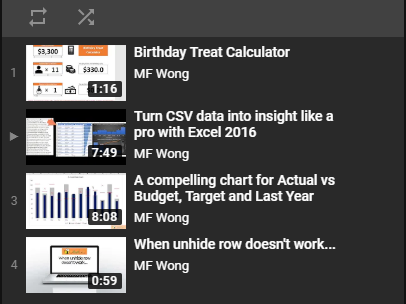
Glad to share with you my second video here. This video is about how to plot a compelling to compare Actual vs. Budget, Target and Last Year data. The written instruction is available in previous post – A compelling chart in three minutes…
I spent more or less the same amount of time (~12 hours in total, on and off) to produce it comparing to the first video. However this video is 8-minute long, which is eight times longer than the first one. In a way, I am doing it more efficiently. 🙂
Honestly it takes much more time and effort than writing a blogpost. After making just two videos, I can imagine the GREAT efforts all other Excel geniuses like ExcelIsFun, MrExcel.com, Leila Gharani, Excel On Fire (just to name a few) they have put on their channels, where you will find a lot of great Excel videos. Really appreciate their efforts! 👍 Indeed they have inspired me a lot through my Excel journey.
I am not dreaming about my channel will become as popular as theirs. Though I do hope, my channel will get more popularity from time to time, especially in the Cantonese-speaking communities. My goal is to produce one to two videos per month. Should you have any comments/suggestions, please leave your comments.
Last but not least, if you like my video, please SUBSCRIBE my channel.


YES YES! Videos take a long time to produce. Congratulations on your second video, it’s excellent. And thanks for mentioning me. I’m glad to have been inspiring of your efforts.
Keep going!
LikeLike
Thank you Oz du Soleil! I will keep going. 💪🏻
LikeLike