Without a single input in formula bar. UI only. No kidding!

What’s even more unbelievable? The above can be done in just a couple of minutes.
The technique discussed in this blog post is applicable to Excel 2016 or later. And the techniques used are mainly Flash Fill and Quick Analysis, which are available since Excel 2013. But why I said it’s applicable to Excel 2016 or later? Because the chart types Histogram and Pareto were introduced in Excel 2016.
I am not saying that we cannot perform the above transformation using Excel 2013/2010. It’s just a matter of time + higher skill level is required.
Let’s see how it can be done in Excel 2016!
Before we dive into it, let’s examine the data first:
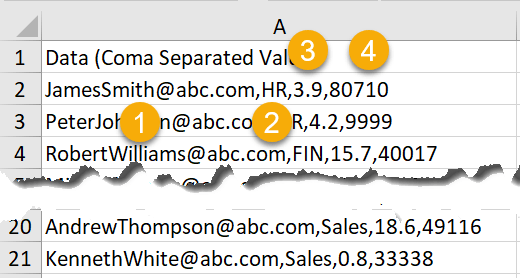
OMG… the data we are dealing with are residing in a single column:
- The email address
- Department
- Year of Tenure
- Salary
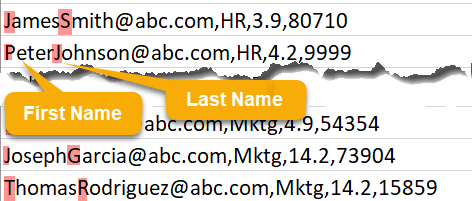
A closer look at the email, we see a partner of First Name and Last Name, which is denoted by capital letter.
To most regular users, data like this is a nightmare.
Think about the tasks we want to perform:
A) Separate the data into a table showing
- First Name
- Last Name
- Department
- Year of Tenure
- Salary
B) Calculate the averages
C) Show distribution of Year of Tenure
D) Aggregate Salary by Department, and identify which department takes up the most salary cost
But you know what? With Excel 2016, we can do it in a couple of minutes without a single input in formula bar!
By the way, CSV is good. 🙂
Last see it in action:
1) Extract data using Flash Fill
Thanks to the clear pattern, Flash Fill performs the task with ease
2) Get averages using Quick Analysis

Did you know… The icon was always there… please check it out
3) Insert Histogram via Quick Analysis
Please observe the changes on the chart when I input the values for bins
4) Insert Pareto via Quick Analysis
Note: Pareto chart takes one series, thus the chart first created show the “Year of Tenure” on primary Y-axis. The trick is to manually adjust the data series to “Salary”.
5) Final touch up using Table via Quick Analysis
DONE! Excel 2016 makes the tasks never easier!
A video with narrative is now ready 🙂 Enjoy! under production. Will share here once it is ready. Stay tuned!
Cantonese VO:
You may download a to Sample File to follow along. Hope you like this post. 🙂


Wow thanks
LikeLike
Wow welcome 😄
LikeLike