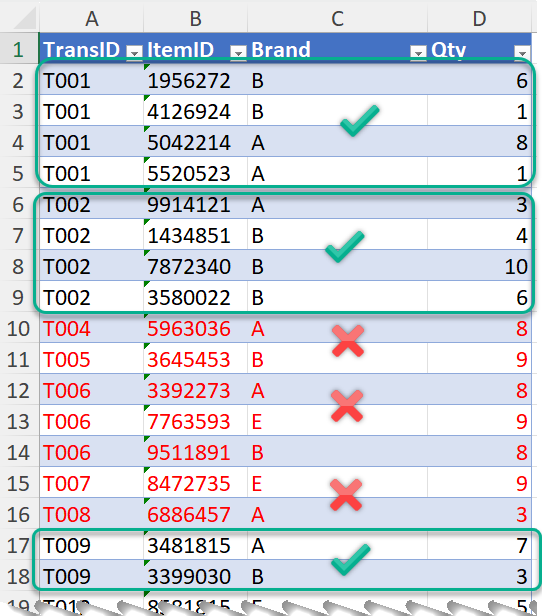
The challenge – How many transactions with just Brand A and B together?

This is a common request in retail business to analyze massive amounts of transactional data. A transaction table usually contains a lot of records. As you see in the screenshot above, all items purchased within the same transaction will be displayed on multiple lines, with the same transaction ID. For example, Transaction T001 contains four different items and hence occupies four lines of record; Transaction T004 contains only one line of record as there is only one item sold in that transaction. Of course, this is a simplified example.
Now the question is, how many transactions are there with just Brand A and Brand B together? How many sales generated from those transactions? etc….
Even though it is commonly asked, there is no straightforward way to answer it with traditional Excel. To answer all related questions, first we need to identify those transactions with both (and just) Brand A and Brand B. This is what I am going to show you in this video, using Power Query for Excel of course.
You may download a sample workbook to follow along.
In the bonus session, I will go one step further, to make the solution more flexible by allowing user to input which brands he/she want to focus on. Check it out. I hope you like this video. If you do, please give a thumbs up, subscribe and share! 😉
In the next video / post, I will show you the formula approach to solve this challenge. You will see the power of Excel 365. Stay tuned!


This can be solved in this way:
let
Source = Excel.CurrentWorkbook(){[Name=”tb_Data”]}[Content],
#”Changed Type” = Table.TransformColumnTypes(Source,{{“TransID”, type text}, {“ItemID”, type text}, {“Brand”, type text}, {“Qty”, Int64.Type}}),
#”Grouped Rows” = Table.Group(#”Changed Type”, {“TransID”}, {{“Data”, each _}}),
#”Filtered Rows” = Table.SelectRows(#”Grouped Rows”, each List.Sort(List.Distinct([Data][Brand])) = Brands), //Assuming Brands list is sorted
#”Expanded Data” = Table.ExpandTableColumn(#”Filtered Rows”, “Data”, {“ItemID”, “Brand”, “Qty”})
in
#”Expanded Data”
LikeLiked by 1 person
Thanks for sharing this 😀
LikeLike