Note: This is not a "how-to" post. In this article, I share my thoughts on how people start their Power BI journey, based on my observation and imagination. 😁
When you say you want to learn Power BI, what do you actually mean?
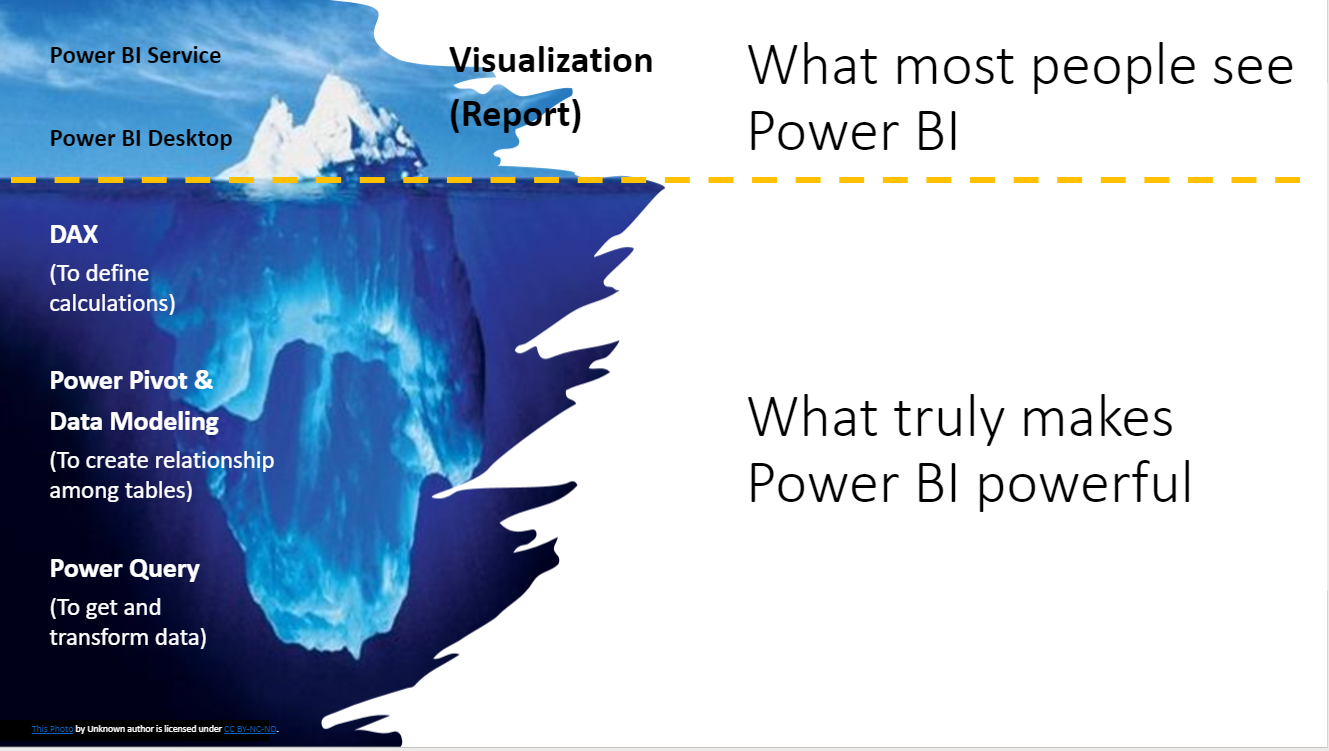
Power BI is a “relatively” new tool for analytics in business world. With no doubt, Power BI is getting more attention for its great power in visualizing data; in creating stunning dashboard; in getting insights from data by interacting with it, just to name a few. Many people think that Power BI is a visualization tool because this is what they “see” from a user’s perspective. This is super normal. However, what they don’t see, and probably are not aware of, are the building blocks behind the sense.
Hey, don’t get me wrong. These are not the building blocks I talked about.

From my experience, these are the starting points most users user/learn Power BI. It happened because they are users of Power BI report that is created by IT (or someone else). They don’t need to worry about (indeed have no idea) how the data is being pull together from various data sources (where Power Query plays a crucial role); they don’t need to worry anything about Data Model or Power Pivot (how different tables are linked together through relationship); and they have never heard of DAX because they don’t have to. Without any knowledge just mentioned, they are still able to use the report to get information they need.
Learn Power BI as user
To most users, Power BI is an “enhanced” version of Pivot Tables and Pivot Charts that interacts with each other. When they said they want to learn Power BI, they actually mean they want to learn how to “navigate” a Power BI report. This is probably the most easy part of learning Power BI, I would say.
Learn Power BI as report creator
When they have become more familiar with the user interface of Power BI, they want more. They want to view the same metrics from a different perspective; to slice and dice the reports with a different dimension or attribute; to deploy a different visualizations; and so on. This is the moment they need to go back to IT.
Although the revision can be done quite easily and quickly in most scenarios (provided that the report is built upon a good data model), IT is too busy to do it for you on demand… At this moment, IT would say:
“Hey, Power BI a self-service tool. You can do so by simply drag and drop the data fields you need; you can change a line chart to a column chart by clicking this and that… “.
And this is exactly the moment user needs to explore the report through Power BI Desktop.
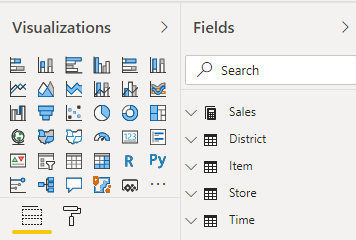
At this stage, they started to learn how to create a report by putting corresponding data fields into an appropriate visualization. They started to feel the power of Power BI because they realized that it required no extra effort in creating interactivity among different visuals on the report. That is simply an awesome experience to traditional Excel user.
(Side note: Creating an effective dashboard is more than just putting different charts and matrix together. It requires understanding and learning of data visualization which could be a big topic by itself.)
The user experience was great along the way (again provided that the data model was built properly), especially when they learned how to edit interaction among visuals; how to control a visual interacts with other visuals; how to set a filter to a specify visual; how to drill up/down/through; how to create “groups” to an attribute; and so on and so forth. They felt that they could fly with Power BI already.
Then one day, they realized that they were stuck with the data fields (only made) available to them. They wanted to do some analyses to evaluate the sales of products that tied to a marketing campaign. They had the list of products but they did not know how to incorporate that into the data model (coz they had no idea of Data Model yet). What could they do apart from seeking help from IT. Well you know, IT is always busy. They couldn’t fix your ad hoc request on demand. Please raise a ticket and wait… and wait and wait… That’s fine if your boss can wait too. 😁
So what they did? They exported the data from Power BI to Excel and did the analyses the Excel way. (At this point, no one knows there is a such great feature called “Analyze in Excel”)
Problem fixed and every one was happy.
Really? They all knew that ad hoc request was never one-off request. Similar ad hoc requests came in from time to time. They needed an agile solution.
Learn Power BI as developer – Stage 1 with Power Query
Power Query came to rescue. They realized that every Power BI report started with Power Query. Regardless of data sources, Power Query is the starting point to get and transform data before we could analyze data.
What’s more surprising? Power Query could perform data cleansing / messaging / transformation tasks through mainly User Interface in Power Query Editor. That means no coding is required; just click this and that, here and there. And the best part is, Power Query recorded all the transformation steps as if a macro-recorder, but in a better way. A click of refresh would perform all transformation tasks again when data got updated or new data came in. That’s the automation they sought after for too long!!! And they could not believe that Power Query has been sitting around in their most-frequently software – Excel, waiting for them to discover since Excel 2016 (even earlier as add-ins).
With Power Query, they found that they could do the VLOOKUP to the product table easily. In this way, they could add / modify product attributes in their reports easily.
Learn Power BI as developer – Stage 2 with Data Model and Power Pivot
Well… great power comes with great responsibility. As they learned more (although just the basic of Power Query), their bosses expected more. More ad hoc requests with higher complexity came in. This time, they were requested to compare sales with budget, which was never part of the analysis (hence not in the data model). They needed help again. Instead of approach IT, they approached to a well-known Power BI guy in the office. The guy was so happy that he was not alone finally. While they explained their thoughts to solve the problem, the Power BI guy realized that they learned Power BI in a “reverse-engineering” way. What they tried to do is to create a single giant table with all the attributes and metrics being put together. That’s very typical for traditional Excel (Pivot Table) user.
“Wait! That’s not the way we do with Power BI!” The Power BI guy said.
Followed by showing them how to do that with Data Modelling technique. That’s the light-bulb 💡 moment to everyone with tradition Pivot Table mindset.
“Welcome to the world of Data Model and Power Pivot! 😉” The Power BI guy said.
“That’s too good to be true!” They said.
“Yes it is! And the best is yet to come! You will see.” The Power BI guy said.
“We can do so much with Power BI right now. We are all happy and satisfied!” They said.
Learn Power BI as developer – Stage 3 with DAX
With the (basic) knowledge from Power Query, Power Pivot to Power BI Visualization, they managed to create extraordinary reports by applying filters to different visualizations; setting custom interactions among visuals carefully. They could be able to solve majority of their data problem. However, deep inside their heart, they felt a missing piece, but they don’t know what it is.
We don’t know what we don’t know!
DAX, Data Analytic eXpression, is the missing piece to most self-learners.
What is DAX? Simply put, DAX is the formula used for Power BI (and Power Pivot), as if functions and formula in Excel.
In order to get the most out of Power BI, we have to learn DAX.
Thanks for reading all the way to here. Does the above resonate your Power BI Journey?
After all, this is not a technical piece of writing. Power BI could mean something even more. It really depends on what roles you play and what background you come from. I hope it gives you a generic overview of the core elements of Power BI and help you plan the way you learn Power BI in the journey.
My two cents
First – Power Query
From my point of view, we should always start from Power Query as it is the starting point for creating any Power BI report. It gets and transforms data into the shape for analysis.
What’s more, Power Query is also available in Excel. We can use it for many situations we encountered at workplace day by day. Power Query is the must-have skill if you are a serious Excel / Power BI user.
Second – Data Model
After Power Query, you are ready to move to Data Model. You don’t have to be a master of Data Model. As long as you have a good understanding of Star Schema, you will find it super useful in your Power BI Journey.
Third – Power Pivot and DAX
To many users, it’s very tempted to stop at Power Pivot. However, we should not. If you want to be advanced in Power BI, DAX cannot be missed.
Learning DAX could be painful but surely rewarding.
Forth – Data Visualization
As mentioned, putting charts and matrix together on a report is super easy in Power BI (when you have a good data model built). However it does not guarantee an effective data visualization. A good data visualization should be self-explanatory. Anyone (in the related field) should be able to draw insights from a good data visualization without a third party explaining the visual.
Good data visualization is easier said than done.
However, data visualization is often underestimated by report builders. We have to invest time to learn it.
In summary, we start with Power Query, followed by Data Model, Power Pivot and DAX. Finally apply Data Visualization skills to deliver the final output of your analyses to end users.
Having said that, if you are lucky enough to work in a company where you have a dedicated (and responsive) team to take care of all those “un-seen” parts of Power BI, you may then focus on learning the Data Visualization, but please don’t underestimate the effort it may take.
Whichever path you take, I hope you enjoy your Power BI Journey! 😉


