Basic of One way Data Table
This is an extension of the post Start the new decade with Goal Seek in #Excel.
In that post, we talked about using Goal Seek to find the initiate savings required to obtain a total savings of $1000 at period end, given the other variable remains constant.
How about if we want to have a list of outcomes with different initiate savings?
Do we need to change the value one by one manually and then do the great copy and paste? Like the screen-cast below… 🤦♂️
Of course we don’t! We can do it with (One-Way) Data Table under What-If Analysis.
You may download a Sample File to follow along.
Note: You may want to read this post to understand the context before moving on.
1. Setting up the spreadsheet
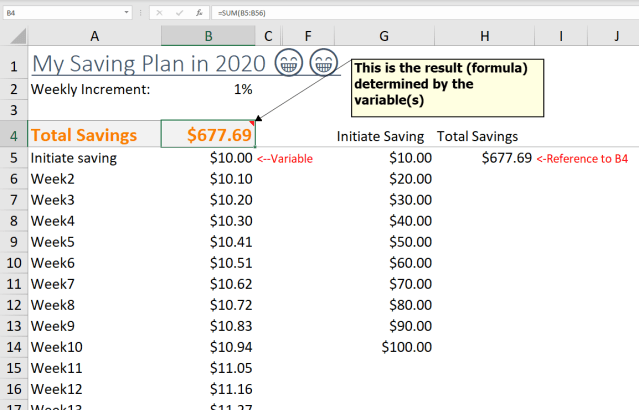
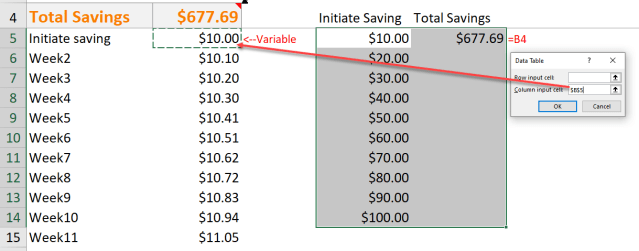
The range G4:H14 is where we are going to put the Data Table.
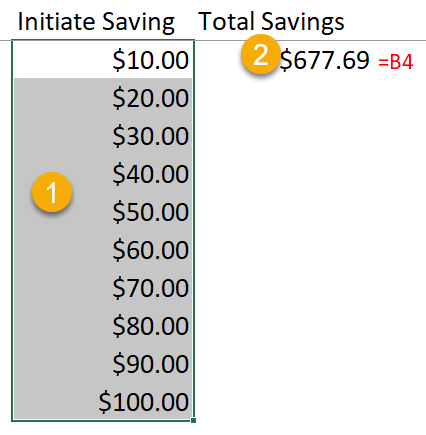
- The values pre-input in G5:G15 are the list of initiate saving (variables) that we want to examine.
- In H5, input =B4 (i.e. referencing to the variable)
2. Inserting Data Table
Now we are ready to insert the Data Table. Nevertheless, we have to select the range G5:H14 first. (tip: It’s up to you to have a shorter/longer list)
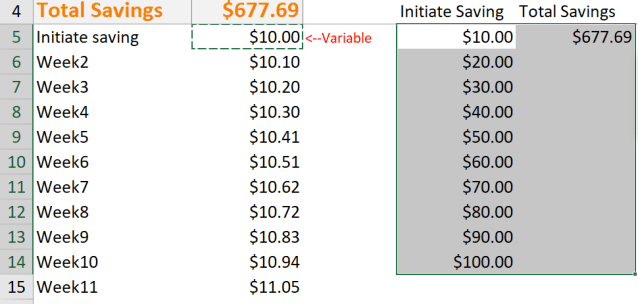
With the range selected,
- Go to Data Tab
- What-If Analysis
- Data Table…

In the Data Table dialog box, reference to $B$5 (the variable) in the Column input cell:
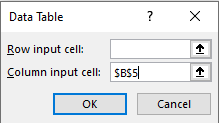
Then OK
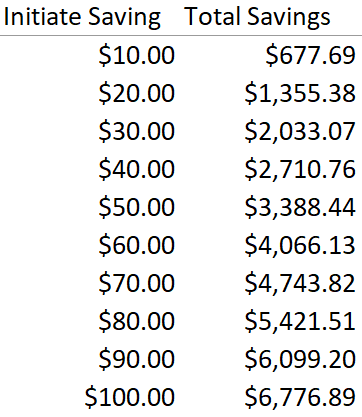
Here we go!
Let’s watch it in action!
 Tip: We may change the values in column G if required
As simple as this! 🙂
Well, you may be thinking… can we add one more variable (Weekly incremental % in our example) so that we can have a cross tabular result listing multiple scenarios? Yes, we can. Let’s talk about it in the next post! Stay tuned. 😉


