This post is about showing you how to perform a common task of adding a column of
- % of Total
- Running Total
with Quick Analysis in Excel 2013 or later.
Latest Excel makes things easier, just that you may not be aware of…
Well, what I meant “latest Excel” here are those versions since Excel 2013. Of course, Excel 2016 and of course Excel 365 is getting even better.
You may think that Excel 2013 is a product of 5 years ago… there is no way it can be called “latest”…. uuuum… that’s true. However I am living in a city where most people I know (across different companies) are still using Excel 2010 or before. Believe it or not? 😛
What is even more surprising (or ironic): when I met someone who uses Excel 2013 or later, I looked at them with my “hearty” smiles and told them how lucky they are with all those new features like Flash Fill, Quick Analysis, etc….. (not yet to mention about the new FUNCTIONS). The response I got was mostly: “What are these?” and some of them unconsciously showed an attitude of “I don’t care…”
Needless to say, many people have never clicked the tiny icon that showed up automatically when a range of data is selected.
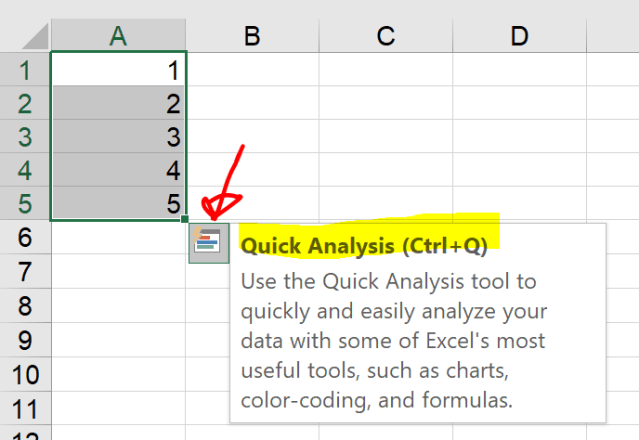
So, I am going to show one quick tip of using Quick Analysis (provided that you are using Excel 2013 or later) to add a column of
- % of Total
- Running Total
A picture (especially an animated one) tells thousand words, so let’s look at the screencast below:
Super easy! Isn’t it?
The Quick Analysis Tool is intuitive. Check it out.
p.s. There is no sample file accompanying this post. I highly encourage you to explore Quick Analysis with your own data if you are using “latest” Excel. 😛


Great stuff! I use the Quick Analysis tool all the time to quickly visualize my data.
I created a list of all things you can do with the Quick Analysis tool, which you can read here: https://spreadsheetdaddy.com/basics/quick-analysis-tool/
Sorry for the shameless blog promo, but I think it’s VERY relevant to this post (maybe even worth adding as a contextual link 😉)
LikeLike